This post highlights the improvements Qlik has made to its combo chart after its May 2021 release. It goes through using an out-of-the-box Qlik Sense object to create a dumbbell chart.
A dumbbell chart is a dot plot that emphasizes the difference between 2 data points by drawing a line between two dots. You can use them to compare any two data points – this period vs. last period, actual vs. target/budget, or min price vs. max price.
Let’s create one and then reflect on a few other, broader points later.
Dumbbell chart recipe
- In your Qlik app, start with a combo chart.
- Add a dimension and then two measures that you want to compare. The measures should be based on the same unit of measure (eg. currency, percent, units, etc.). After this step, you should see the following basic combo chart that we’ve all grown to love.
 Note: Qlik makes a poor decision to automatically assign the first 2 measures to a separate axes. I’ve seen people not realize Qlik does this automatically and make erroneous conclusions. I hope we may see some cognitive engine magic to more intelligently break out measures into different axes depending on a measure’s numeric range. In other words, it might only assign different axes when one measure is a currency amount in the thousands and the other is a percentage.
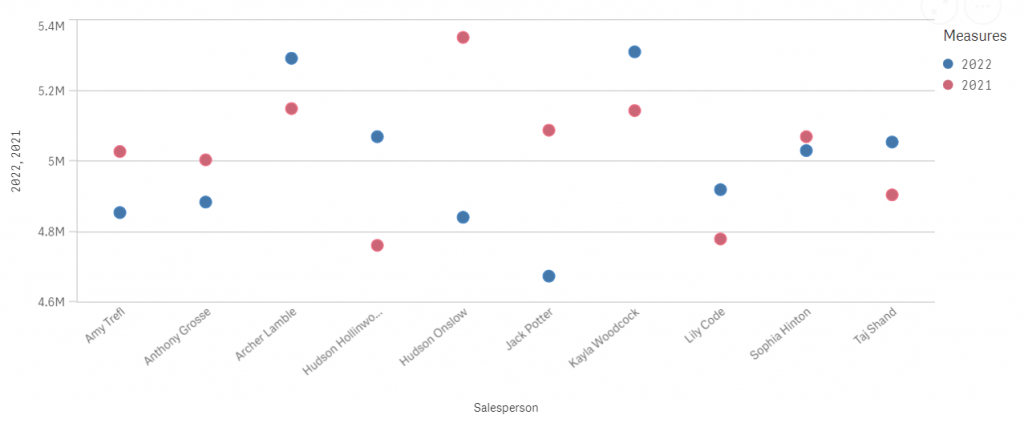
 - Next, go to More properties, and make both measures a Marker, assign both to the Primary axis, and if necessary, customize the shape and color.

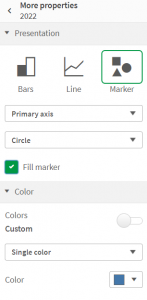
After these changes, your chart should look like the following chart.
 Note: For as much as I like Qlik’s effort to keep the chart properties panel clutter-free, I’m not convinced that the More properties button is the perfect solution. Its purpose is not at all obvious. One developer even told me that Qlik had removed the ability to change whether a measure is represented by a bar, line, or symbol. So, I wonder if they can make the button blink? 🙂
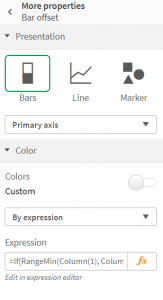
 - Now add two additional measures. Label the first Bar offset and define the expression as
If(RangeMin(Column(1), Column(2)) < 0 and RangeMax(Column(1), Column(2)) > 0 //If one measure is positive and the other negative
	, Column(1) // then assign bar offset to be the 1st measure
    , If(Column(1) < 0 and Column(2) < 0, -1, 1) * RangeMin(Fabs(Column(1)), Fabs(Column(2))) // else the measure closest to zero
)
Label the second Bar range and define the expression as
If(RangeMin(Column(1), Column(2)) < 0 and RangeMax(Column(1), Column(2)) > 0 //If one measure is postive and the other negative
	, Column(2) // then assign bar range to be the 2nd measure
    , If(Column(1) < 0 and Column(2) < 0, -1, 1) * Fabs(Column(1)-Column(2)) // else the distance between the measures
)
Note: These expression are complex so that they can handle whether both dots are positive and negative, or whether one is positive and the other negative. They can be simplified if you are sure that the first two measures are both positive or both negative.
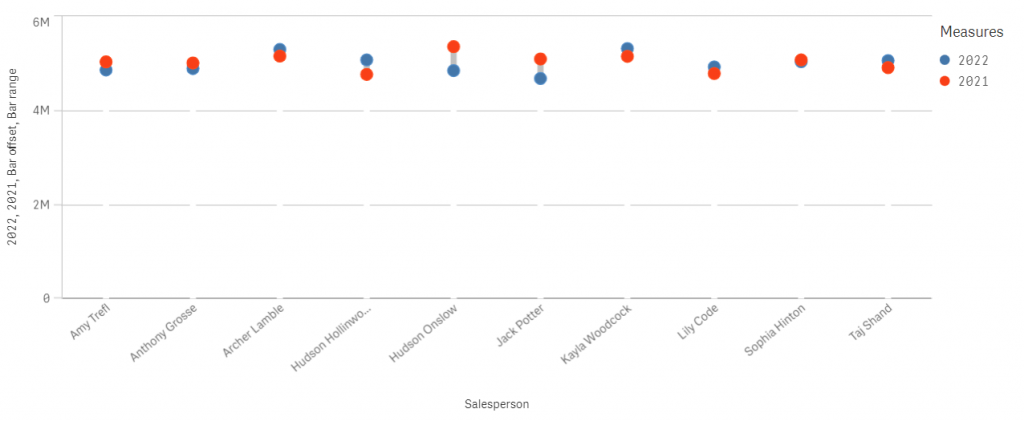
This is how your chart should look at this point.

- Next, change the properties of Bar offset and Bar range to be bars and assign them to the Primary axis.
For the color, define this to be the following expression for Bar offset. Note: White(0) makes the bar transparent and allows gridlines to be visible behind the bar.=If(RangeMin(Column(1), Column(2)) < 0 and RangeMax(Column(1), Column(2)) > 0 //If one measure is positive and the other negative , LightGray() //then it is part of the barbell and give it a color , White(0) //else it is an offset and make it transparent )
Then, define the color for Bar range to be
=LightGray()
You can swap LightGray() for any other fixed or conditional color. Note that we use a color expression in Bar range instead of a color from the color palette so that it disappears from the legend. (Yeah, for once this shortcoming is actually useful.)
You chart should now look like the following.

- The final major step is to change the bars from Grouped to Stacked in Presentation, and in the Styling button at the top of Presentation, make the bar width something narrower.
It should now look like a dumbbell chart.
- Finally, we can do a few cosmetic improvements, and yeah, orient the bars horizontally just because we finally can!
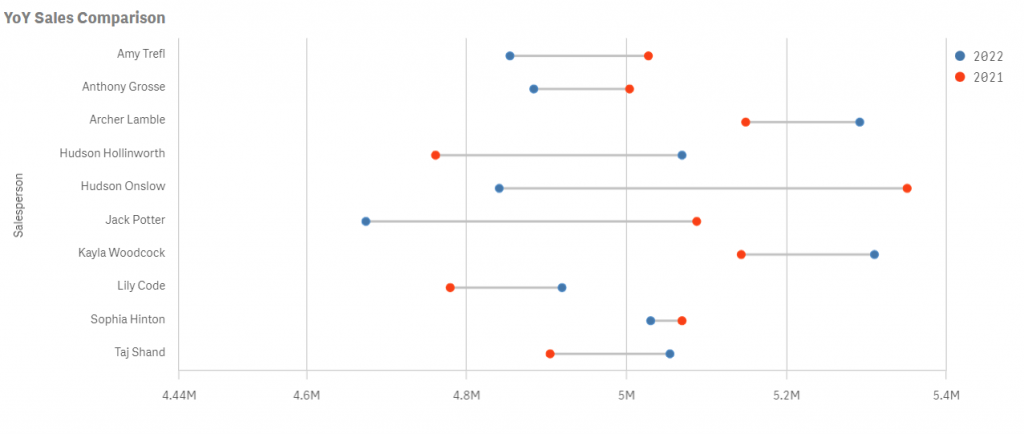
Note: I do not add 0 to the x-axis because the line between the dots in a dumbbell chart reinforces the purpose of this chart as a way to analyze the differences between two values and not their actual amounts.
To calculate the minimum value of the x-axis, you can use the following expression template.=RangeMin(Min(Aggr(chart measure 1 expression, chart dimension)), Min(Aggr(chart measure 2 expression, chart dimension))) * .95
Takeaways
Qlik Sense’s charts are created for less technical, self-service users. Chart types are very specific to what they show and there are few chart property options available to adjust them. Qlik’s visualization extensions have been a great way to build custom charts, but web development skills have not been a resource that I’ve seen readily available to analytics teams. However, as Qlik adds additional chart options, they may indirectly give us the building blocks to construct other chart types. In a Qlik app, native charts are displayed before extensions and they are available at no additional cost, so I would recommend you work to use them before an extension.
Finally, continue to stay tuned to What’s new in Qlik Sense. Almost a decade after Qlik Sense was first introduced, it may finally be open-season for creating custom charts without having to depend on your web development skills to create extensions.
Thanks for making this easy to follow and replicate, Karl.
One possible design enhancement that comes to mind that would be making the bar color red or blue instead of gray, depending on which value is higher. I think it would make the chart easier to interpret, at a glance.