Here you are.
An app loading bitcoin price data from the Binance exchange every hour.
Sell The News.
Often when you hear stock or crypto traders talk about big social or news events, one of the things that is being said in that situation is “Sell the news”. By this they mean that when something is hyped or overly positive, you might want to close your portfolio positions for that stock or currency.
Bitcoin kind of sits in the same situation as of writing this article (February 24th, 2021). If the above situation is true or any new situations occur, here is where you can track and see whether these events do anything with the price of Bitcoin.
What does the app show?
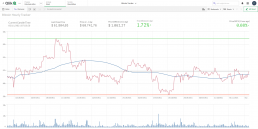
In the above interface you can see a variety of numbers and visualizations based on Bitcoin data. Below you can see a screenshot with numbered dots for which I provide an overview of definitions.

1. The time of the last candle for which the app was reloaded
2. The current close price of the last candle
3. The price of the same candle (time) 7 days ago
4. The difference in price for the candles mentioned in point 2 minus 3
5. The difference in price versus 7 days ago as a percentage
6. The price difference of the last candle versus the same candle yesterday
7. This is the trend chart for the price for the last couple of weeks
- The green line indicates the price peak
- The grey line shows the average price
- The Red line shows the lowest price in the range of time available
8. A chart with the volume for bitcoin being bought or sold at that time
What about the data?
The data in this app mentioned earlier comes from the Binance exchange. One of the largest exchanges in the world. The data in this app is reloaded every hour from the exchange’s API. Documentation for that API and its capabilities can be found at https://github.com/binance/binance-spot-api-docs/blob/master/rest-api.md.
The data pulled from this API is the kline data. This is the data making up the candles you see in a typical stock chart. Although the tracker above isn’t using this type of visualization as I am only interested in the closing price of bitcoin.
The script in the app uses a sub routine for loading the bitcoin prices and other data that comes from this API endpoint.
The subroutine CALL used in the app is:
CALL GetCandles ('BTCUSDT', '4h', 4*6*7, 200, 'BTCUSDT', 0, 'Airtable')
The sub routine takes a few arguments to work correctly:
1. The currency you want to load the data for
2. The timeframe intervals for a candle for which you want the data (You can find the interval settings in the API docs when searching for ‘Kline/Candlestick chart intervals’
3. The number of candles you want to load (Or: the number of hours back you want to load) till the limit of 1000 candles.
4. You can leave this 0 (zero) as it has only a function in my original script
5. The name you want to give your table in the data model
6. 0 or 1 for qualifying your table with the table name as a prefix for your fieldnames
7. The name of an existing REST connection in your server setup (Can be any as the routine uses the ‘WITH CONNECTION’ statement)
As a preceding script tab in my app I use this code for the sub routine layed out in the above example. I am not going to explain the code in detail. The best learning is studying this code yourself. {<And I am a lazy writer as well ;)>}.
The code in the subroutine is just a transformation for getting the data for the candles for bitcoin into a better structure for handling it. The data after transformation looks like this:
My challenge for this data is to build the price and indicator logic to spot potential position entries or exits. Like the example below.

The fun thing with this is the massive amount of historical data available and being able to backtest the logic you are trying to create. Probably one of my team mates at dataonthe.rocks will create an algorithm to predict the prices of bitcoin based on this data.
We will see.
With this previous section I conclude my article. I hope you now know how to get bitcoin data into your own apps. And that with the sub routine found here you can load the data for any currency listed on the Binance exchange. Next to that the API also hosts a lot of other data sources for your trading to get to the next level.
Think about what you can do with a full view and combined data for:
- The order book at a high frequency
- Trades being made every minute
- 24hr ticker price statistics
With the API and the load script you could even automate your trading if you wanted to. Lots of possibilities.
Have fun doing whatever 😉